EuroStat & Countries Data - 2022 Births Data
Another dive in births data (and Neonatal Mortality) - illustrating that a major fertility problem affects (at least) Europe, and requires transparent investigations.
Introduction
Pfizer recently released its disastrous clinical trial data results1 on pregnancies. Over the last weekend, Jessica Rose2, Jikkyleaks, and Geoff Pain3 all made interesting points we invite you to consult. The Mouse has provided a short but precise summary of these results below (you can access the tweets quoted in this post, by clicking their picture).

It is concerning to hear that the results are as bad, or even worse, than expected, especially in light of the initial “missing results” alert raised by Maryanne Demasi in February4. We have already expressed multiple concerns regarding the potential fertility impacts of the current “health” policies.
Our attention was brought to the issue by an analysis by Christine Cotton of VAERS data5, and firstly we conducted last year our own in-depth analysis of VAERS, which revealed a lack of serious tracking of adverse events, and raised significant concerns: aside for the disastrous data integrity, on the high rate of miscarriages & birth anomalies among the reports6.
Secondly, we published detailed articles highlighting the drastic decline in births in Sweden7 and the situation in Finland8. These findings further emphasized the potential consequences on fertility of the current experiments.
These efforts have been just a drop in the sea of similar concerns. To quote just a few more,Arkmedic's blog made an amazing job dismantling the studies compiled by 'vaccine' advocate Viki Male in two dedicated articles9 (and providing precious historical perspective, such as “the thalidomide sequel”10).
Pierre Chaillot, for the French-speaking readers, made an excellent analysis of the European trends, which can be viewed on his YouTube channel11. A paper version, which can be translated to English is also available12.
Twitter’s Christine “Mackoi”13 publishes in depth analytics on the French disaster, which can be consulted on her website14, and again, the french speakers can watch this presentation of hers to the CSI15. Viviane Cuendet carries on a similar task on Switzerland’s data16.
Igor Chudov has also blown the whistle countless times on the matter ; You can find more information on his Substack17 or his Twitter18.
Another Substack, kindly pointed to us by Vigilance per VAERS , examines the European situation via another angle than the perspective we will present here19 and is worth reading.
Twitter’s “BirthGauge”20 and Substack’s Tin Foil Apocalypse 2.0 are two other precious references we discovered recently thanks to Jackanapes Junction - all blowing the whistle on the same topic.
We have an accurate idea of the random damages which can and will occur.
Endotoxins inherent to the manufacturing process have been extensively documented by Geoff Pain, along with their potential disastrous impact on women’s fertility21, and for the fetus. Males aren’t spared either22. Yet, every Freedom of Information request concerning their measurements on batches distributed to the public returns heavily censored and unreadable23, to date. Needless to say this censorship is intolerable.
The variability of the product, such as vial quality, storage, and refrigeration are well-documented in the literature, as detailed in this interesting study24. Further, the work of Kevin McKernan25, confirmed by various researchers26, illustrates this variability by batch - and the presence of dsDNA impurities in the products.

Given this overall grim picture, we tackled here visualizations from the EuroStat data, allowing an - as complete as possible to date - view on the European 2022 situation regarding births at country scale.
Problematic
Paul C. “Dobssi”, data analyst who publishes his findings on Twitter, did a commendable job representing the European births crisis in this tweet. However, it's important to note that his interpretation of the data differs significantly from ours. We encourage you to read his thread after this article to gain different perspectives.
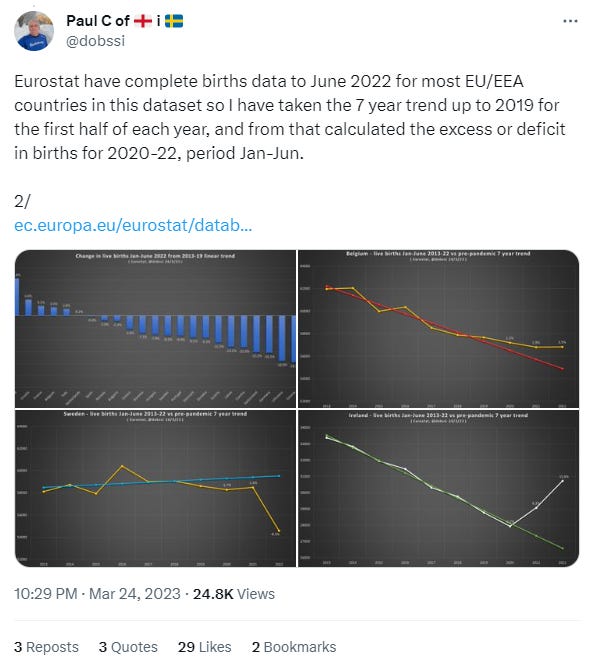
In his March 2023 tweet, he shared a chart comparing births from January to June 2022 with the linear trend from 2013 to 2019. This chart, reproduced below, is particularly concerning.
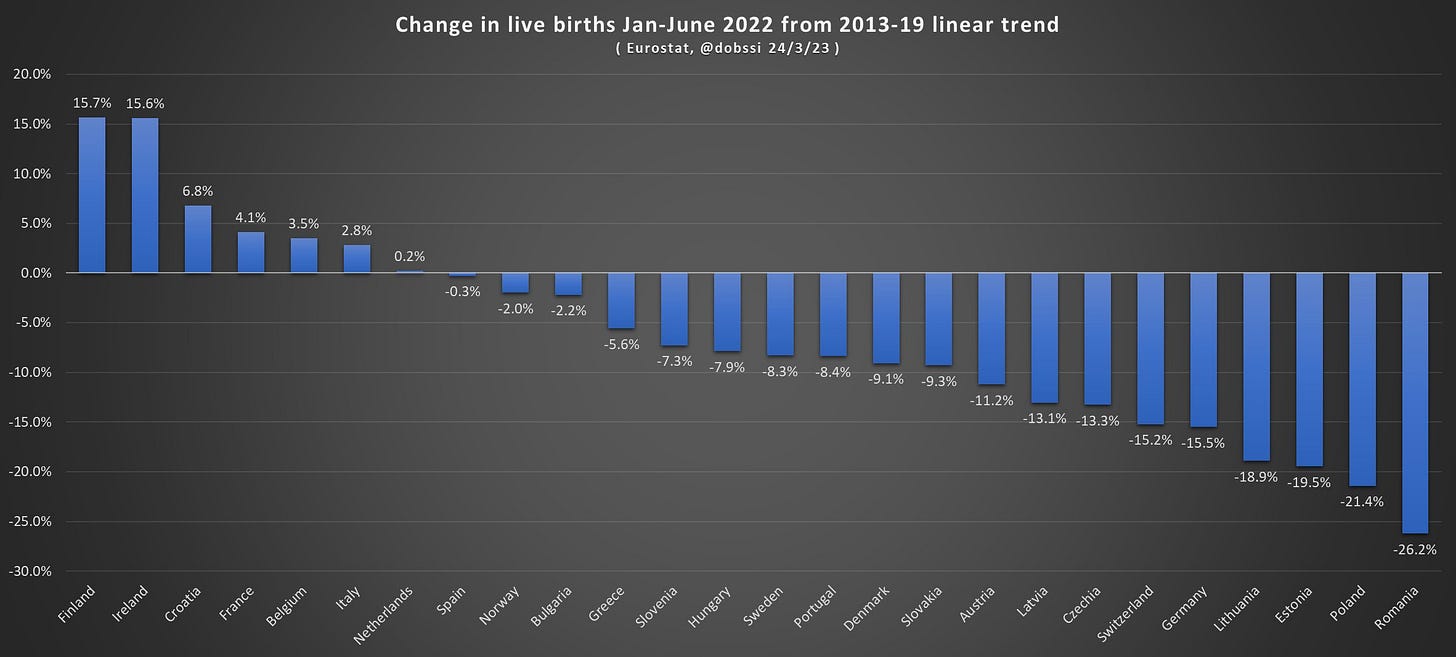
However, we had a few initial questions and criticisms. Firstly, France appeared to have positive signals, which seemed contradictory to what we knew, meaning that France's birth rates were "artificially" inflated by foreigners giving birth on French territory in the DOM-TOMS. This phenomenon has been increasing recently27, and the French institute, INSEE, had also raised concerns about extremely low birth rates28.
Another issue was that Paul C.'s view was limited to six months, which doesn't provide a complete picture of the yearly situation. This limitation may be due to the data source. Births are seasonal, but their “seasonality” isn’t month-conditioned (rather related to the seasons & temperatures29), and we prefer analytics over the full year, not to miss trend changes due to high month variability.
A last concern was that the doses data used, and the “single observation point” angle, seemed like a too simplistic approach to characterize the problem.
To address these concerns, we went to examine EuroStat’s data ourselves, despite our strong (and justified) distrust for data aggregators. We also updated as much as we could the missing data, in order to obtain the 2022 figures from countries' official sources (and exceptionally, in cases like Malta from the press, when the local press is the “official source”). Operations performed on the data are detailed in the method section, following the analytics.
Births Compared to 2013-2019 Baseline
To compare recent birth figures with the "pre-COVID" situation, we took a different approach than our last two papers on the subject, by using a baseline from 2013 to 2019. This aligns with Paul C.'s perspective on the data.
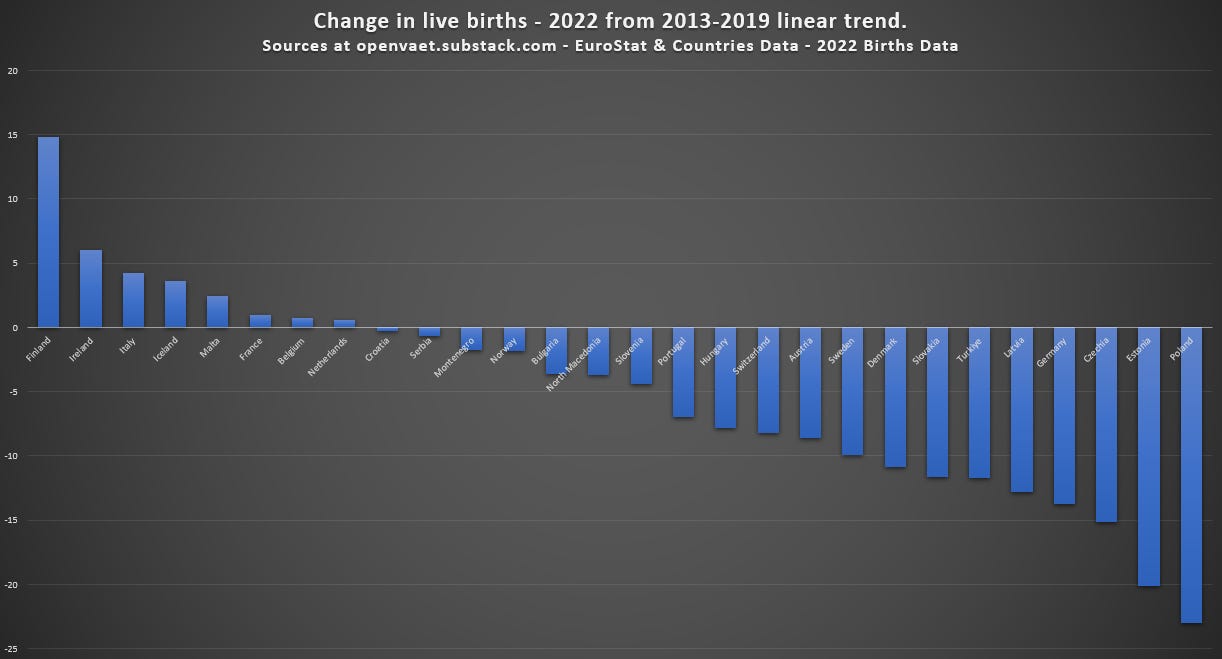
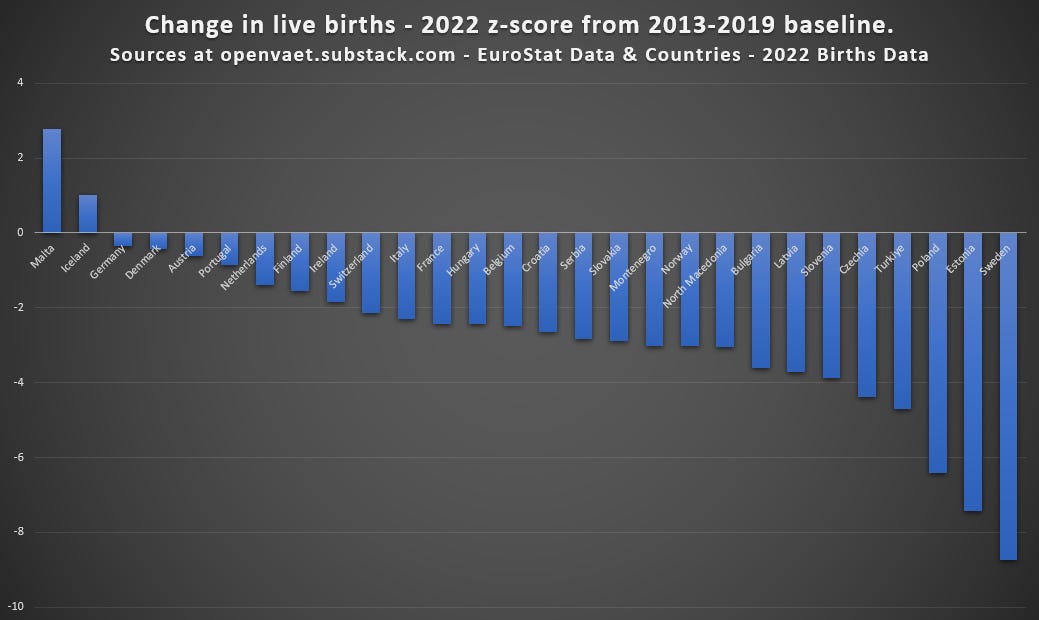
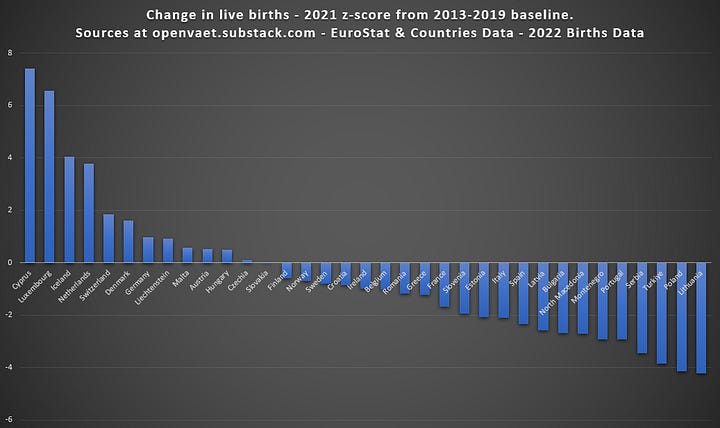
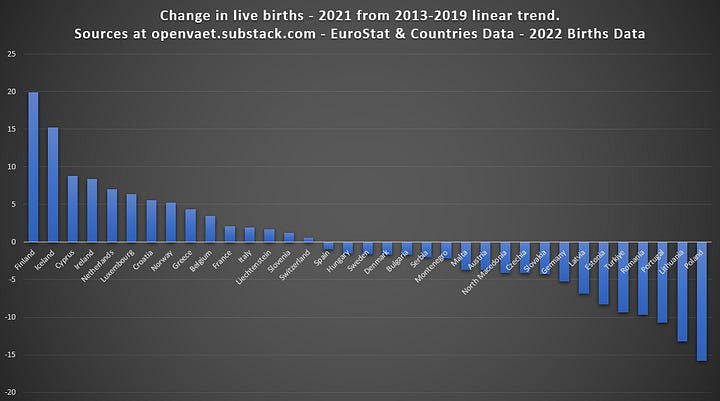
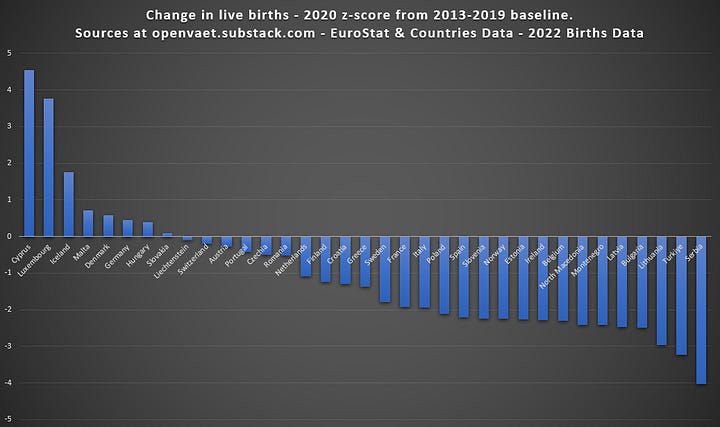
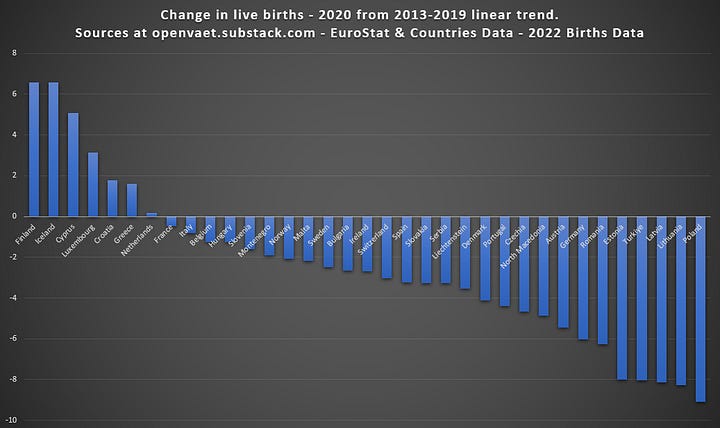
We present the "big picture" through three yearly charts (2020, 2021, 2022). We measured the percentage of change against linear trends, and used z-scores as additional metric.
Note that some countries featured in the reference chart are missing, due to lack of complete 2022 data.
2022
2021
2020
Interpreting this data
Obviously, from these updated graphs, something bad is happening, and it’s happening in most places where we have sufficient EuroStat or country-level data to tell.
Firstly, we can note that with a 2013 instead of 2010 baseline start, Sweden drops in 2022 at -8.7 sigma instead of an already record -6.34 we were reporting. Translating for Viki30… both scenarios are not supposed to happen.
The rest of the 2022 year is … an obvious disaster. To the quite puzzling exceptions of Malta & Iceland by z-score, and Ireland, Finland, Italy, Malta, France, Belgium & Netherlands by deviation to linear trend, on which we will present a few more in depth analytics.
All we can conclude from this first dataset is that we have a global major issue, and that it requires in depth study and way stronger data transparency. Factors impacting birth rates are an inherently difficult problem to study, yet even to establish.
First of all the problem is multi-factorial and, obviously, lock-downs, economical hardships, and psychological abuse have had a consequent impact, particularly on the poorest populations.
Secondly, regarding ‘vaccines’ themselves, the analysis is complicated by major variables.
What we would really need, having no trust-worthy RCT data31, would be anonymized individual data, detailing mother’s ages, vaccination status, dates, lots & batches numbers, health history and pregnancies dates and outcome data. This data (that they have, and which belongs to the public) is jealously guarded by the ‘public’ institutions.
We are left with global figures, affected by countless biases, and new issues.
The undetermined size of each "batch" - which can contain up to a million doses32, or precise public documentation of the areas where they were shipped, is a first limitation.
It is even difficult to find reliable data by age groups and sex on “doses administered”. Aggregators data such as OurWorldInData33, or modeled data such as HealthData34 are inherently flawed, and are presenting as beautiful, unified, and clean datasets something which is, in reality, a sh*t storm of data conflicts, different mods of data collection, diffusion, and human errors.
Paul C. advances several arguments to discard the hypothesis of “vaccines” being a probable cause.
- “The higher the vaccine rates, the higher the births”. As we shall review (a work originally done by Twitter’s “Mackoi” and developed by Pierre Chaillot), the data tells us a different story, and the neonatal deaths are significantly rising with the vaccination campaigns in countries studied. That such signals are visible beyond the statistical noise tells us a major new factor is at play.
- Counter-examples of countries with positive percentage to trend are presented. As we illustrate below, these are countries whose trends were already disastrous prior COVID & vaccines, and which remains decreasing.
- Counter-examples of countries (Romania, Bulgaria) with decreasing percentage to trend, despite low vaccination rates, are presented. They were also subject to major factors such as extreme poverty prior pandemic, worsened by the lock-downs, and are the poorest countries among these currently studied35.
Vaccination of Women at pregnancy ages & Neonatal Deaths
We first focused on reviewing the situation of France, which constitutes a good case study, with a slightly positive deviation to linear trend and a negative z-score.
We picked the metropolitan figures according to INSEE’s data, which doesn’t impact much the linear trend.
We then cared about monthly infant deaths per 1000 births, again occurring in the metropolitan area.
Metropolitan France’s Births Trends & Neonatal Deaths
The deaths records are available on INSEE’s data, with yearly files for the most recent years36, and archive files for 2010-201937. We used only the 2013 → 2022 files, which are cleaned from encoding errors, reformatted & synthesized in the following JSON file38.
The monthly births in Metropolitan France are available on this INSEE page39 - and we represented the yearly percentage of deviation to the 2013-2019 linear trend below.
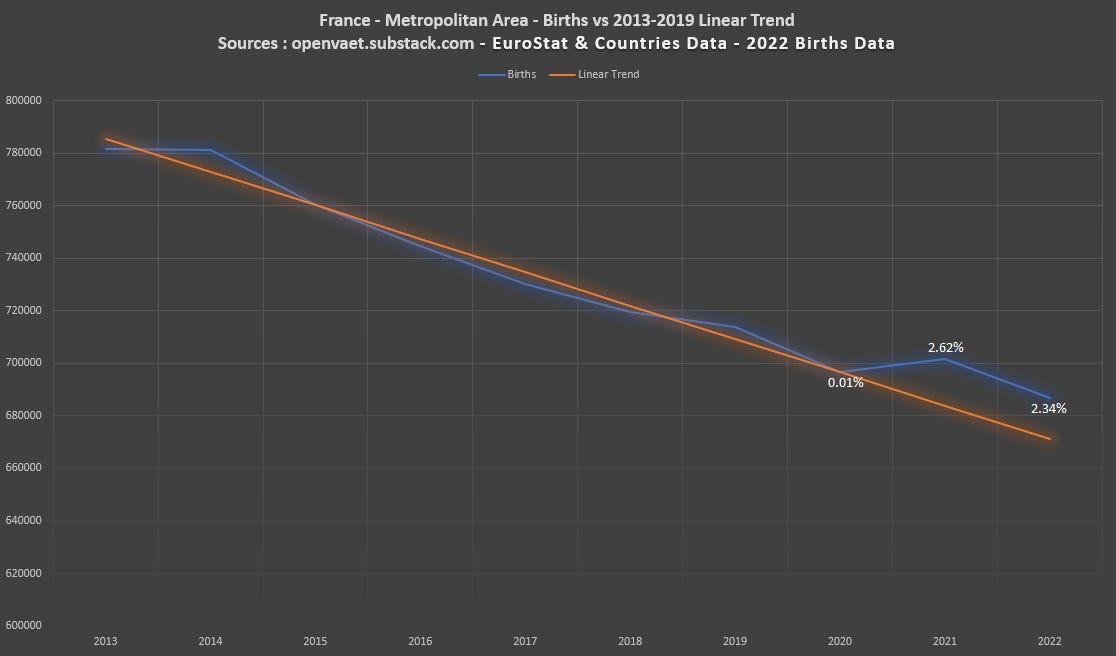
France, at 781 621 births in 2013, and 714 029 births in 2019 (dropping by 67 592, -8,6% over 7 years), shows a timid increase toward a disastrous trend in 2021, and falls back to the decreasing trend in 2022.
The z-score compared to the 2013-2019 metropolitan baseline is :
- -1,821 for 2020
- -1,636 for 2021
- -2,171 for 2022.
It’s therefore hard to discern any positive signal regarding the safety of the ‘vaccines’ from such low positive deviation.
We can further investigate a potential impact of ‘vaccines’ (the injections, first not recommended40, became opened to pregnant women since April 15 202141).
Shall the products be safe for pregnant women, we should see no impact on negative metrics such as neonatal mortality (babies deceased during <= 28 days of life). On another hand shall the product cause a risk for the pregnant women & their child, we should observe an increase of difficult & early births, along with birth defects, translating in an increase of the neonatal deaths.
We reproduced (with small variations related to the geographic scope and time covered by the baseline) the work of Christine “Mackoi”42, and calculated the expected deaths, based on each month’s births, and a 2013-2019 mean of deaths under or equal 28 days (2.496 deaths / 1000 births).
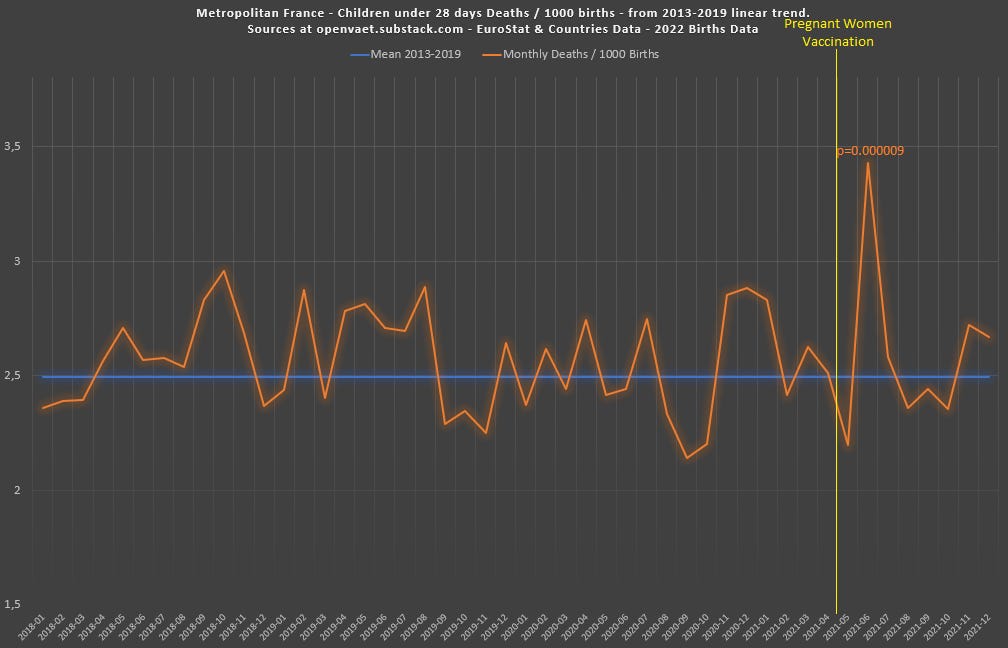
The June 2021 spike (Poisson’s probability for this event to happen = 0.000009) stands out as an obvious outlier, and while we could expect 143.5 deaths on the 57 482 births, 197 are observed.
The most significant variation of neonatal deaths occurred, in France… immediately after the designation of pregnant women as a population to prioritize.
Unfortunately we can’t reproduce this last analysis on the entire Europe.
First because EuroStat doesn’t provide updates to its infant & neonatal death statistics since 202043 (why would you monitor that closely while deploying experimental treatments during a pandemic…). Second because most countries’ statistical institutes aren’t providing sufficient granularity.
Scotland’s neonatal deaths.
Scotland’s statistical institute provides a satisfying neonatal deaths overview44.
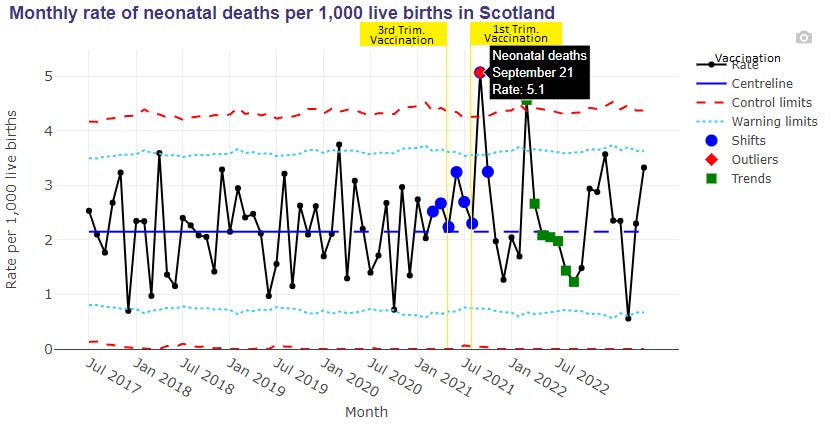
Starting in April 2021, vaccination had been available to pregnant women in their third trimesters.
In August 2021, the JCVI (Joint Committee on Vaccination and Immunisation) recommended vaccination for pregnant women in any semester45. In September, the neonatal death rate took off far above confidence intervals, triggering, with another outlier in 2022, an investigation on the phenomenon in Scotland46.
These two alarming observations are also consistent with the findings of David Schuldman47, highlighted and developed by Josh Guetzkow in a December 2022 article48, which illustrated a spike in Neonatal deaths in Israeli data, during the roll-out to pregnant women.
Shall you be aware of other states allowing sufficient granularity (weekly of monthly figures on both neonatal deaths & live births) to study the phenomenon on the same angle, please communicate them in the comments. We checked without success Belgium, Ireland, Italy, Finland, Germany, Greece, Hungary, Netherlands, Slovenia, South Korea, Sweden, and Switzerland - but it’s easy to miss some page deployed in the emergency measures which could yield useful data.
Other countries with positive births to linear trend
Netherlands’ point has already been satisfactorily explained by Pierre Chaillot, to whom we also borrowed the above Scottish point (in Netherlands’ case, a massive spike of immigration composed mostly of people in reproductive age49).
Malta & Iceland being very small islands & populations, they are highly subjects to batch-level variables we can’t control, and have poor granularity at state level data. They therefore didn’t appeared as key priorities (although we would love to have sufficient data to study Malta further, as the main outlier by both z-score & deviation to linear trend).
Ireland
Ireland presents the same kind of strongly decreasing trend (-14% over 7 years) than France, as represented below.
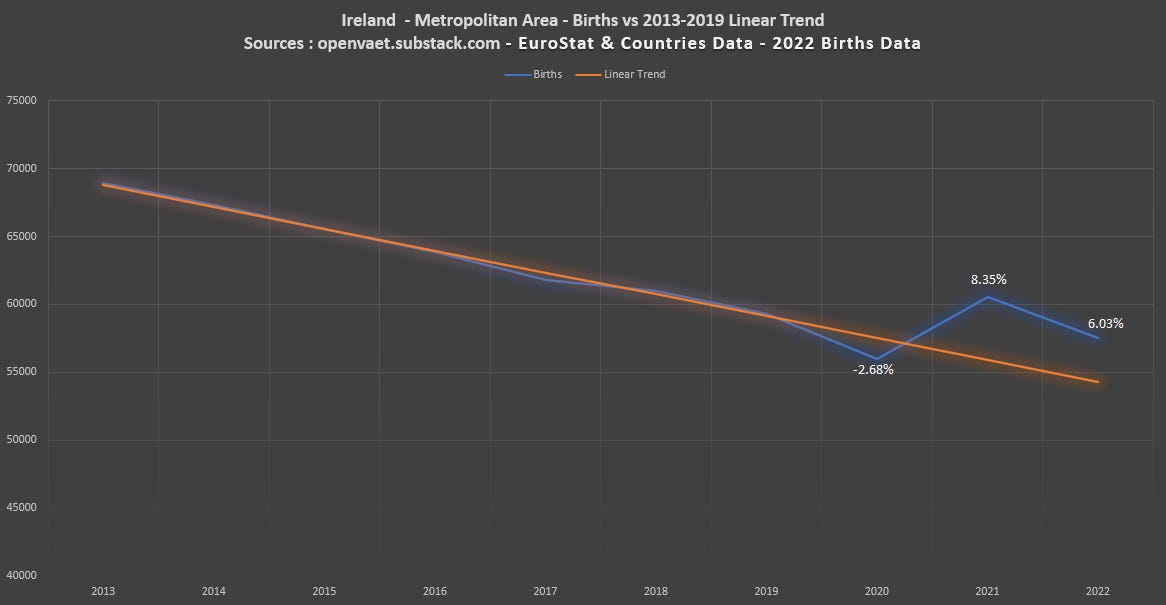
It also has very specific demographic characteristics (high marriage rate, high rates of Catholic citizen, etc.), and, with the very positive signal noted on 2022’s first half by Paul C. strongly reduced, it doesn’t appear to us as a valid counter-signal to the trends observed in much larger countries.
Nevertheless, the situation of Ireland’s re-bounce will require further (and later) investigations.
Finland
As will the situation in Finland, which - while remaining negative in z-score, escapes the rest of the European countries to plunder far below linear trend.
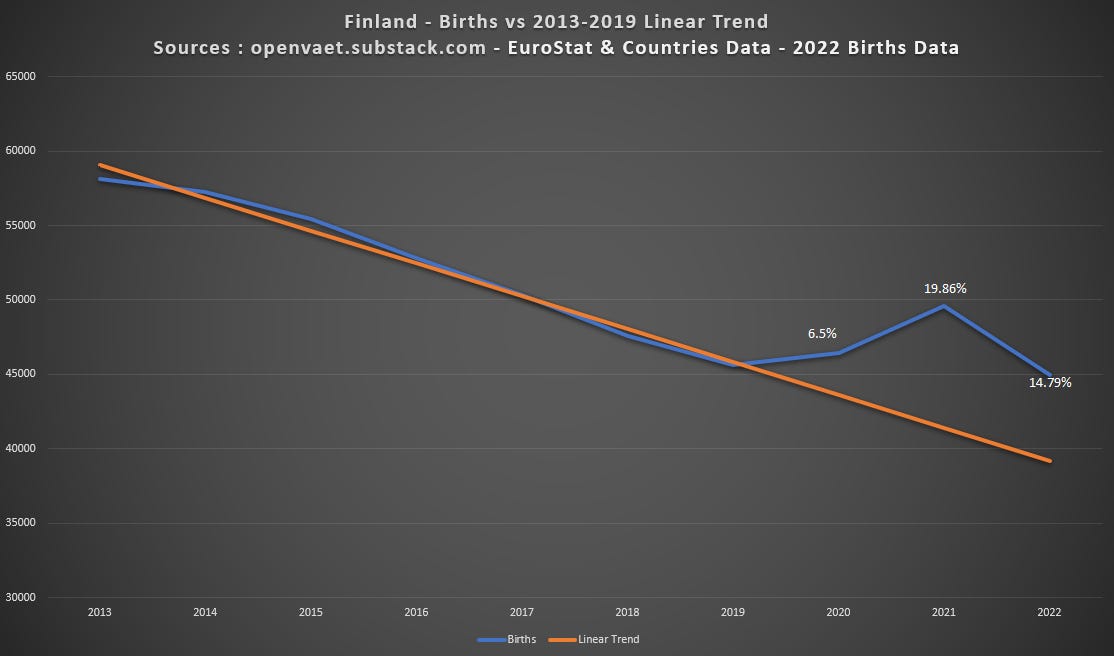
We already mentioned Finland, and our interpretation doesn’t change at this stage. “Less bad than planned” doesn’t constitute a positive signal against the major red flags we highlighted in other countries.
EuroStat Births Sources & Data Integrity Issues
We used two datasets for our analysis. The first one (dataset 1) was the one referenced by Paul C.50 in the thread quoted above. The second one51 (dataset 2), which we used as data integrity control, was taken on this page.
Of course checking the data integrity of aggregators is always a good idea, and we found serious offsets in births figures of their own datasets. To quote a few:
- Moldova 2014 : 38 616 in dataset 1 ; 40 909 in dataset 2.
- Moldova 2016 : 37 394 in dataset 1 ; 39 961 in dataset 2.
- Romania 2018 : 202 744 in dataset 1 ; 210 290 in dataset 2.
When two values were conflicting by more than 50 births, pending an answer from EuroStat, we used the highest figure (always in favor of dataset 2). We considered the lowest were provisional figures which hadn’t been adjusted properly in one dataset compared to the other - awaiting for a better explanation.
Countries missing baseline data.
Some countries were lacking baseline data & were excluded :
- Andorra
- Albania
- Belarus
- Bosnia and Herzegovina
- Georgia
- Moldova
- Russia
- San Marino
Births Data Completion
In several instances, the complete yearly figures for 2022 are missing. European countries concerned are Austria, Belarus, Belgium, Bulgaria, Cyprus, Croatia, Denmark, Estonia, Finland, France, Germany, Greece, Hungary, Ireland, Italy, Latvia, Liechtenstein, Lithuania, Luxembourg, Malta, Moldova, Montenegro, Netherlands, Norway, Poland, Portugal, Romania, Russia, San Marino, Serbia, Slovenia, Slovakia, Sweden, Switzerland, Turkey, Ukraine & United Kingdom.
When these countries data were available on the official websites, we used country-level totals:
- Austria’s 2022 births are located on their website52.
- Belarus’s data couldn’t be located.
- Belgium’s 2022 (provisional) births are located on their website53.
- Bulgaria’s 2022 births are located on their website54.
- Cyprus’s data couldn’t be located.
- Croatia’s 2022 births are located on their website55.
- Czech Republic’s data are on their website, along with an alarm on births “sharp drop”56.
- Denmark’s 2022 births are located on their website57.
- Estonia’s 2022 births are located on their website58.
- Finland & Sweden data was completed based on our previous articles (sourced above).
- Germany’s 2022 (provisional) births data are located on their website59.
- Greece’s data are on their website60, but last publication is 2021.
- France’s 2022 provisional births numbers are located on their website61.
- Hungary’s 2022 births numbers are located on their website62.
- Iceland’s 2022 births numbers are located on their website63.
- Ireland’s 2022 births numbers are located on their website64.
- Italy’s 2022 births numbers are located on their website65.
- Latvia’s 2022 births numbers are located on their website66.
- Liechtenstein’s data are on their website67, but last publication is 2020.
- Lithuania’s data are on their website68, but last publication is 2021.
- Luxembourg’s data are on their website69, but last publication is 2021.
- Malta’s provisional births can be found on the local press (ministry figures)70.
- Moldova’s provisional births can be found on the government’s website71.
- Montenegro’s 2022 births are located on their website72.
- North Macedonia’s 2022 births are located on their website73.
- Netherland’s 2022 births are located on their website74.
- Norway’s 2022 births are located on their website75.
- Poland’s GSU figures are reported by multiple press articles but aren’t yet categorized on their website76.
- Portugal’s 2022 births are located on their website77.
- Romania’s press reports historic lows, but 2022’s data isn’t yet final78.
- Russia’s data couldn’t be located79.
- UK’s data isn’t updated since 2019 in EuroStat - refer to this thread by Jessica Rose for 2022 figures80. We will focus on it in a later post.
- Serbia’s 2022 births are located on their website81.
- Slovenia’s 2022 births are located on their website82.
- Slovakia’s 2022 births are located on their website83.
- Spain’s data are on their website84, but last publication is 2021.
- Switzerland’s 2022 births are located on their website85.
- Turkey’s 202186 & 2022 births are located on their website87.
- Ukraine’s situation is obviously a particular case and hasn’t been processed.
The dataset used (.CSV) to build the yearly charts can be found on this Google SpreadSheet88.
The code required to reproduce the analytics presented is available on the following .zip file (to unzip in your regular “openvaet” project folder, cloned from GitHub), and will join GitHub once some hardware’s betrayals will be sorted out.
💬 Join the conversation
Want to like, comment, or share this article?
Head over to our Substack page to engage with the community.
Likes, comments, and shares are synchronized here every 5 minutes.
Download 22-01271-Pfizer-2022-0426.xlsx (July 25, 2022)
Fichier des décès - année 2022
Fichier des décès - année 2021
Fichier des décès - année 2020
Fichier des décès - années 2010 à 2019
Configured export can be accessed directly here.
Chart 3 Live births, quarterly data (absolute numbers)
💬 Join the conversation
Want to like, comment, or share this article?
Head over to our Substack page to engage with the community.
Likes, comments, and shares are synchronized here every 5 minutes.