Sweden - Births/1000 Women & Age groups
Addressing arguments on births drops impacting specifically the younger age groups.
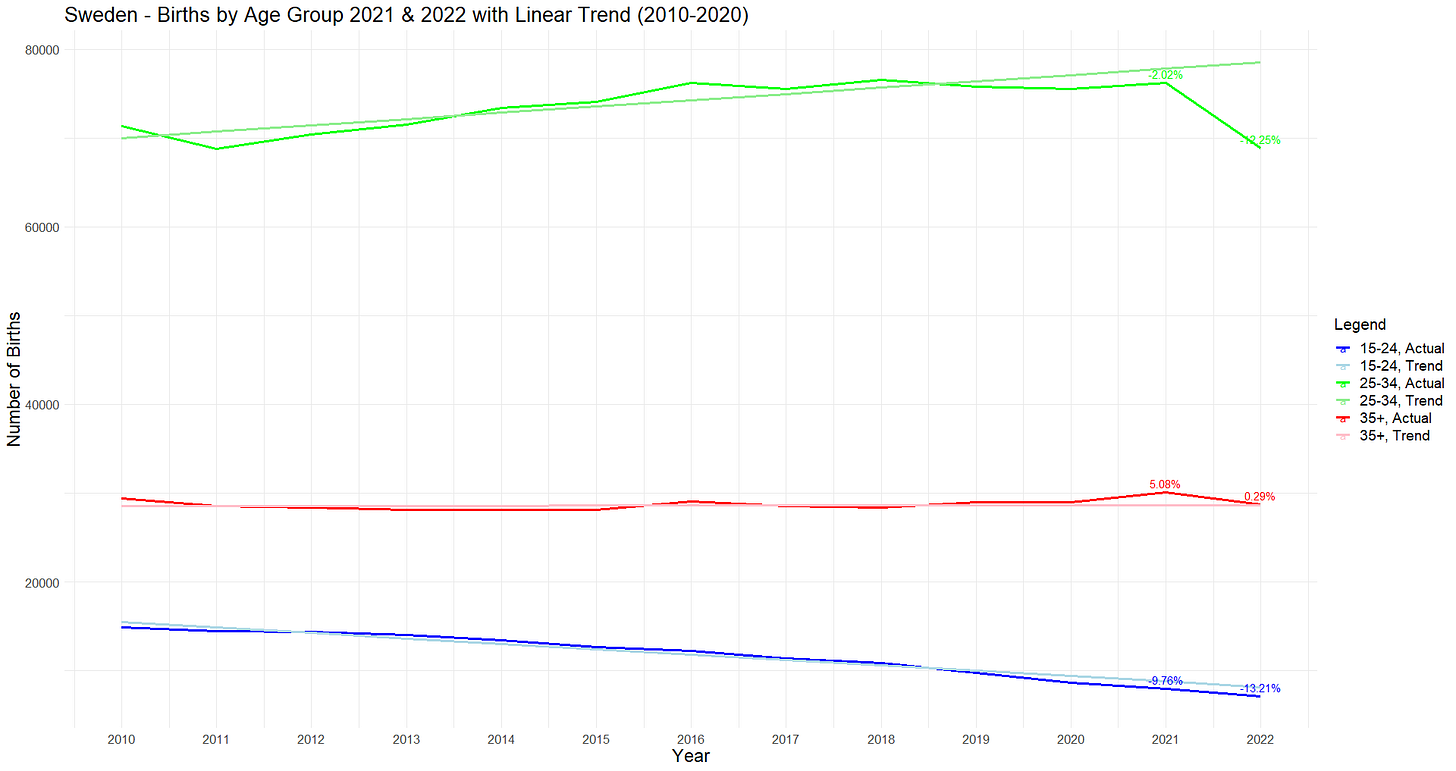
My attention has been drawn to an interesting analysis by Paul C. In this Twitter thread, he highlights the fact that the drastic drop in Sweden’s births affects a younger age group (25 to 34) more than those aged 35 and above, when examining the raw figures.
According to his analysis, this suggests that socioeconomic factors, such as a decline in marriages and less stability in the lives of younger people, are the main factors at work explaining the decrease. He argues that COVID-19 vaccinations should be disregarded as a potential factor, since women in the older age group are more likely to be vaccinated.
I have reproduced his analysis and expanded on why, although the issue is clearly multifaceted, these hypotheses alone were in no case sufficient to explain the current situation.
Births to Linear Trend
First, let's consider the situation as presented by Paul: there's a sharp drop in the birth rate within the most fertile age group in 2022, particularly impacting those aged 25-34, when compared to a linear trend from 2010-2020, excluding those under 15 (R).
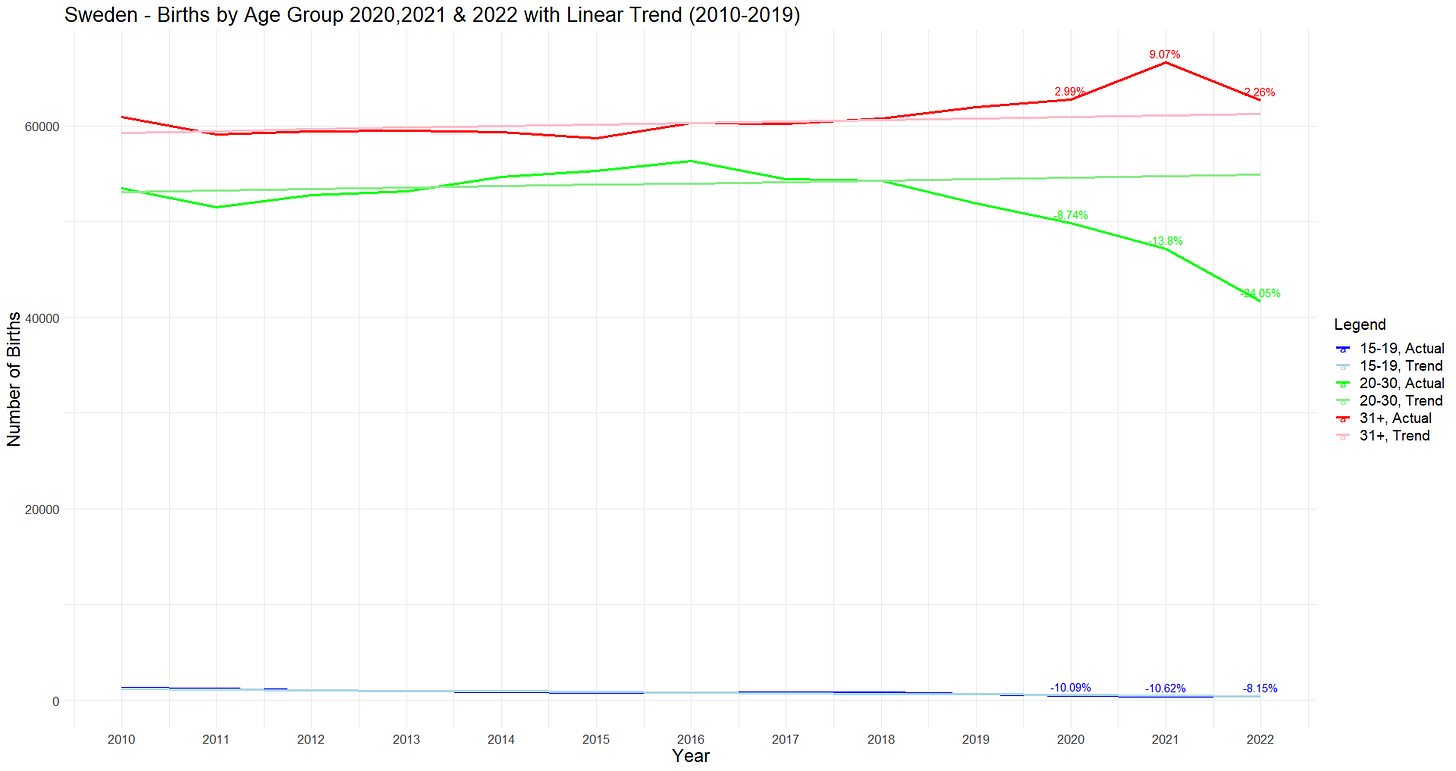
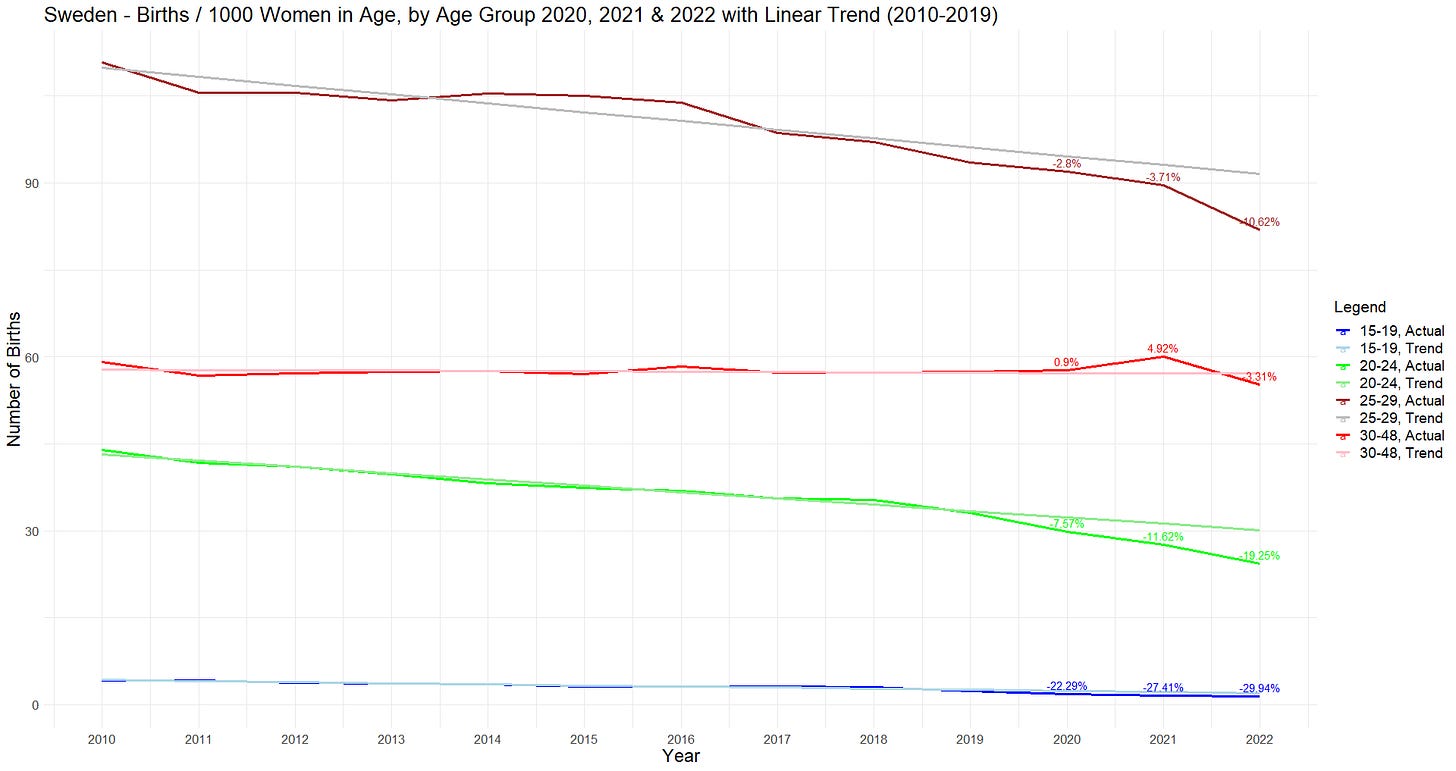
Secondly, I was not satisfied with the age breakdown provided, nor with the inclusion of 2020 - a year marked by SARS-CoV-2 and media-driven panic - as part of the baseline. It is interesting to note that the situation appears even more pronounced when we adjust for the relative contribution of different age groups to the birth rate, and use instead as age groups 15-19, 20-30 and 31+ (R).
I then divided the data into four age groups, also excluding those 49 and older, as they represent a minor number of births and prevent against normalization by population (R).
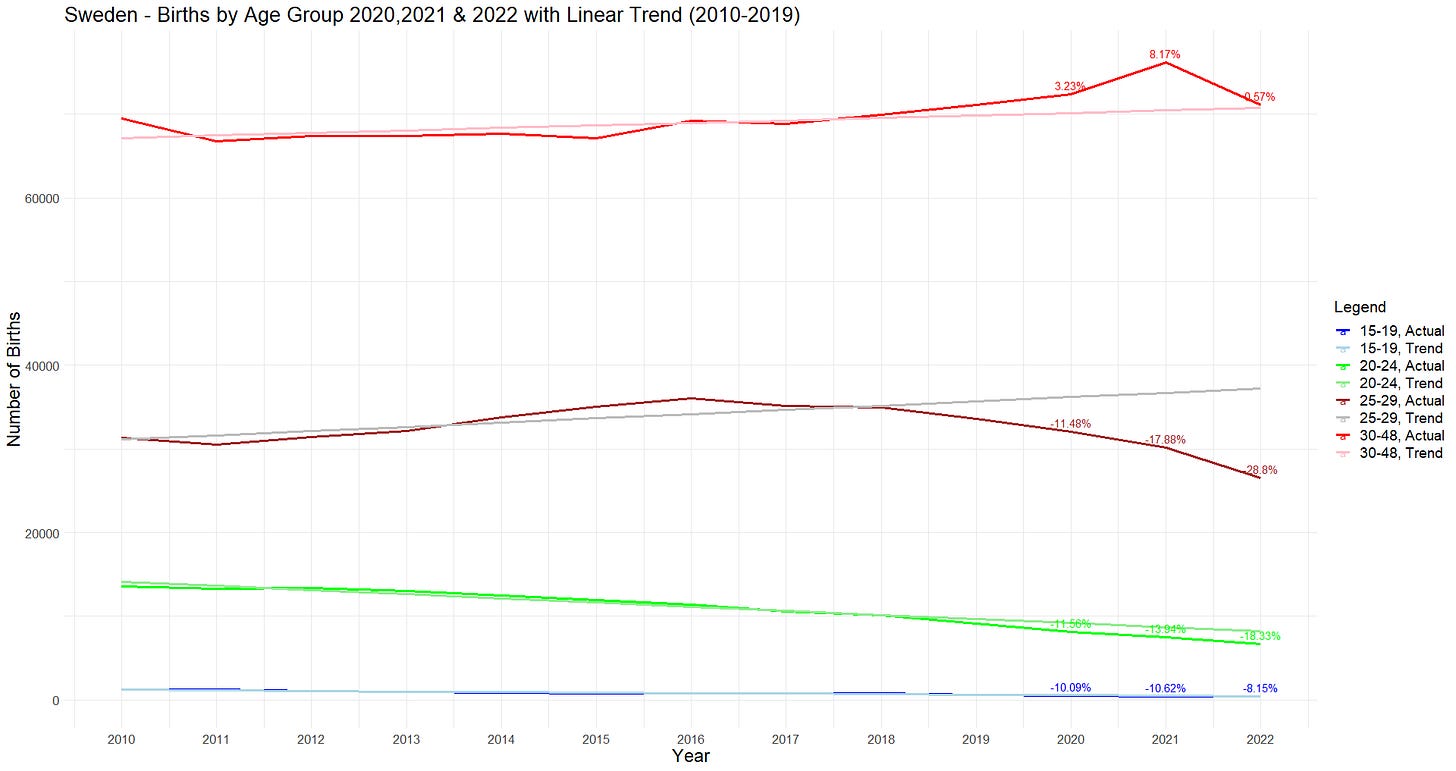
This third breakdown clarifies the following points:
- For the 30+ age group, although there was a 'baby bump' in Sweden post-COVID in 2021, the situation after the vaccine roll-out in 2022 is significantly worse, with a return to the baseline.
- The 15-19 and 20-24 age groups, while affected, are simply on a slightly more negative trend.
- The 25-29 age group appears to have been hit hardest, with a consistent drop well below any baseline.
If economics and household stability were the key factors in the current situation, we would expect the 20-24 age group to be as severely impacted as the 25-29 age group.
Clearly, this is not the case.
To review the situation with further refinement, and to discard major demographic shifts, we need to examine the population within these age groups, marriage rates, and normalize the births per 1,000 women in each age group."
Marriages by age groups
The populations of married and unmarried women (categorized as 'single,' 'divorced,' or 'widows') can be represented as follows for each age group (R).
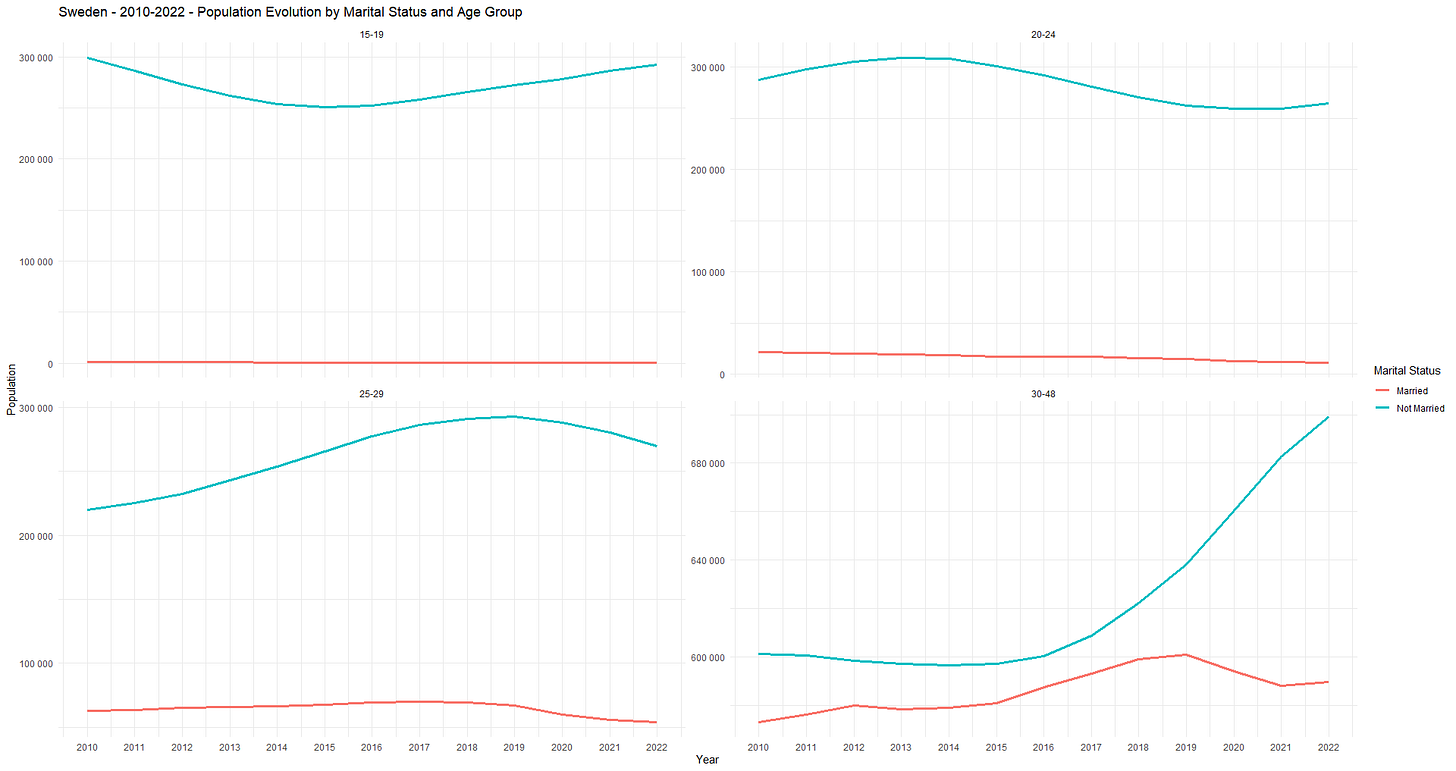
Upon examining this chart, we can already dismiss the notion that a decline in marriages is a significant factor driving the decrease in Sweden's birth rates. This is because the age group that is faring the best in terms of births, the 30-48 group, is also experiencing a decline in marriage rates.
What we do observe is a pronounced demographic shift favoring those aged 30 and over, driven by both an aging population and the significant immigration mentioned in a previous article1.
Births / 1000 women by Age Groups
Lastly, we can, factorizing the demographic shift aforementioned, plot the births / 1000 women in each age group (R).
This reveals that in 2022, the number of births has declined across all age groups, including the 30-48 range. It contradicts the reassuring trend highlighted by Paul C., and constitutes a useful reminder that relying solely on raw figures can be misleading.
Sources
Data on births comes from this table.
- Region : Sweden → All Sweden
- Age of the mother : “Alder, 1-arsklasser och 2 grupper” → Select all
- Sex : men, women
- Year : 2000 → 2022
Save results as → CSV with headings.
Data on women’s population & marriage comes from this table.
- Observations : Population
- Region : Sweden → 00 Sweden
- Marital Status : Select all
- Age : Age, 1 year age classes → Select all
- Sex : Men, Women
- Year : 2000 → 2022
Save results as → CSV with headings.
The useless first 2 lines are removed from the resulting .CSV files.
The code & raw files used are available on GitHub.
💬 Join the conversation
Want to like, comment, or share this article?
Head over to our Substack page to engage with the community.
Likes, comments, and shares are synchronized here every 5 minutes.