Pfizer/BioNTech C4591001 Trial - Making sense of the .XPT deviations
A quick & boring point on how to make sense of the deviation tables.
Don’t lose time reading it unless you’re interested in exploiting the .XPT files yourself.
Introduction
3 .XPT files2 (dumps from the SAS software) are required to document the deviations:
- “S1_M5_c4591001-S-D-dv.xpt” (S-D-dv - Protocol Deviations)
- “S1_M5_c4591001-A-D-dv.xpt” (A-D-dv - Protocol Deviations Analysis Dataset)
- “S1_M5_c4591001-S-D-suppdv.xpt” (suppdv - Protocol Deviations Supplemental Qualifiers)
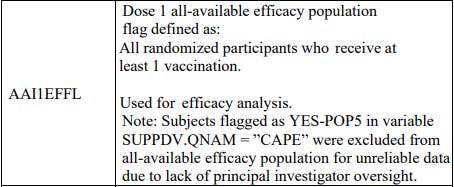
The ADRG3 file documents, page 16, the “suppdv” table as containing a relevant tag to identify the “Dose 1 eligible efficacy population”.
How to make sense of these files ?
When a deviation was registered for a given subject, one row was inserted in the “S-D-dv.xpt” & in the “A-D-dv.xpt” tables (both containing 37 113 deviations’ data registered on 20 578 subjects).
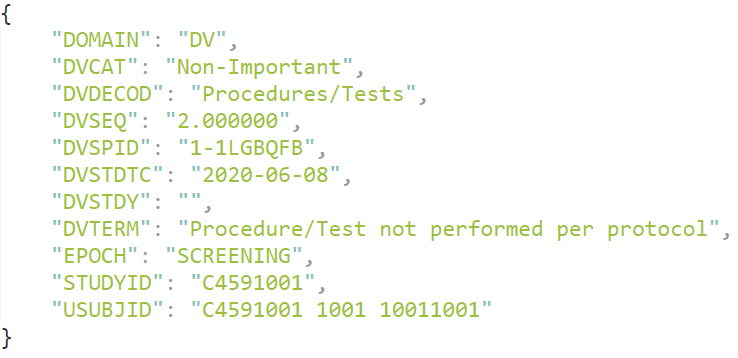
A sample row of the “S-D-dv.xpt” table is featured below:
A sample row of the “A-D-dv.xpt” table is featured below:
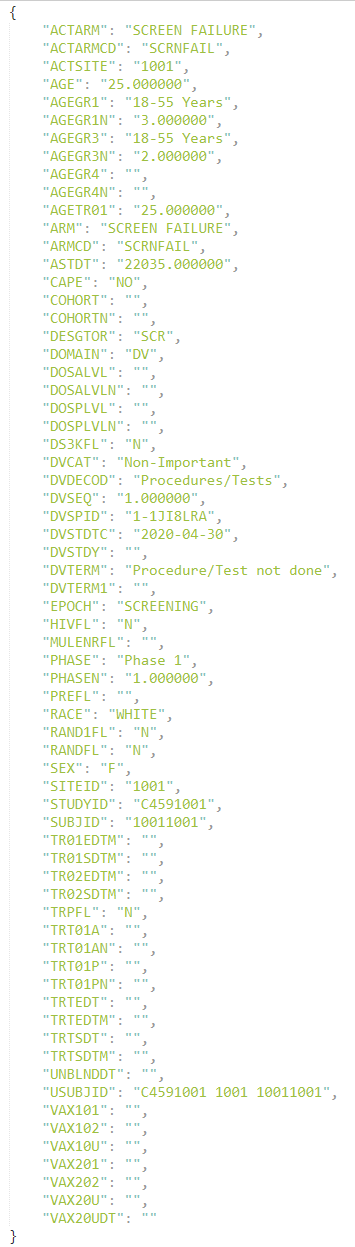
The relation between the “A-D-dv” & “S-D-dv” table is easy to establish, thanks to the “DVSPID” variable (a unique - most of the time alphanumerical id - used to identify the deviation).
At the same time, 4 to N rows were inserted in the “S-D-suppdv.xpt” table (containing 148 510 rows on 20 578 subjects).
An issue we meet, if we wish to reproduce the efficacy analysis, is that the “suppdv” table isn’t timestamped - and the relation with the former tables isn’t obvious.
Therefore, we can’t apply a cut-off date, and require to identify which “suppdv” row matches with a given deviation.
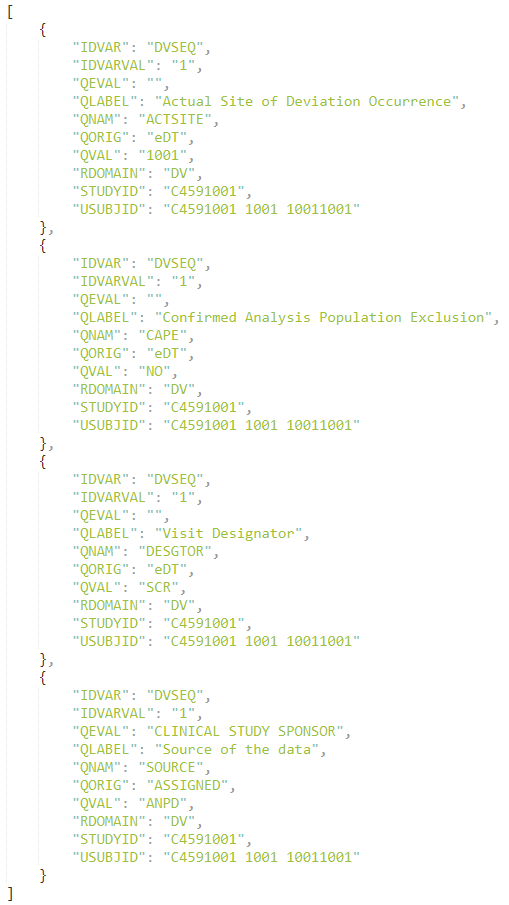
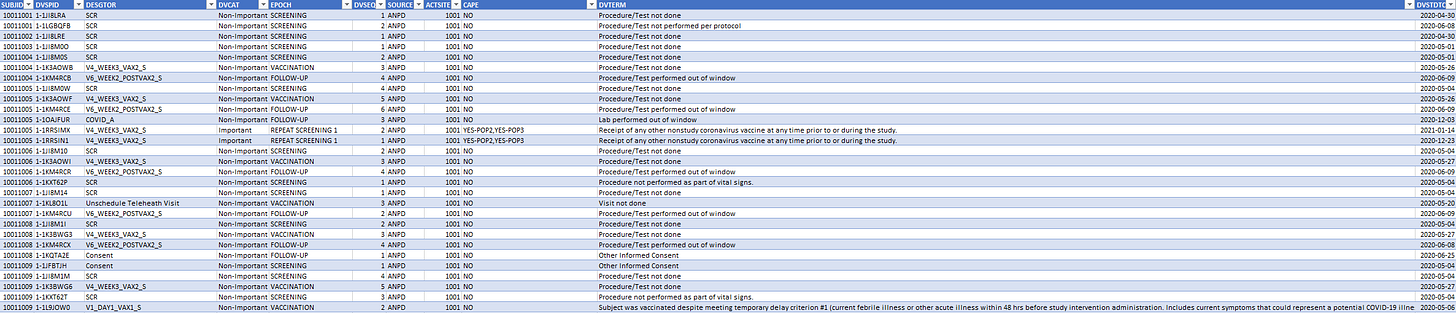
A minimum of 4 rows were inserted, with, for each “USUBJID”, sets of data indicated by a unique “IDVAR”, and for each “IDVAR”, “USUBJID”-“IDVAR” pairs of “QNAM” variables to which corresponds a “QVAL” value.
“QNAM” is at minimum set to:
- “ACTSITE” (site where the deviation occurred)
- “SOURCE” (“ANPD” or “ICON”)
- DESGTOR (the period of the trial on which the deviation occured)
- CAPE - set on “NO”, “No” or collations of “YES-POP{populationConcernedIdentifier}” split by a coma.
Optionally, an additional 5th variable belongs to the “USUBJID”-“IDVAR” pair, “DVTERM1”, provides additional detail to the “DVTERM” present in the A_D & S_D tables. When such cases were occuring, we collated a blank space & the “DVTERM1” data to the “DVTERM” variable.
We verified that for each of these rows, we had a perfect match with the visit date, along with the CAPE & DESIGNATOR variables of the entries. It results in a much more simple & readable structure containing all the data we may want on deviations:
Curated data can be accessed on the following Google SpreadSheet4.
Script used to process to this data unification & output the spreadsheet can be accessed on GitHub.
💬 Join the conversation
Want to like, comment, or share this article?
Head over to our Substack page to engage with the community.
Likes, comments, and shares are synchronized here every 5 minutes.